
As of 22 April 2009 this website is 'frozen' in time — see the current IFLA websites
This old website and all of its content will stay on as archive – http://archive.ifla.org

As of 22 April 2009 this website is 'frozen' in time — see the current IFLA websites
This old website and all of its content will stay on as archive – http://archive.ifla.org



In 1988 we were concerned almost exclusively with the academic market for online services supplied by commercial online hosts. We wanted an indicator for "use". Defining what exactly is a measure of "use" is almost a philosophical problem. Ultimately we settled for an indicator proposed by Schwuchow who concluded that the best is one based on revenues in that it is :
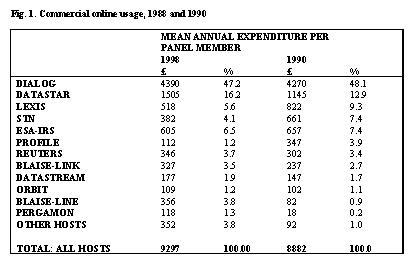
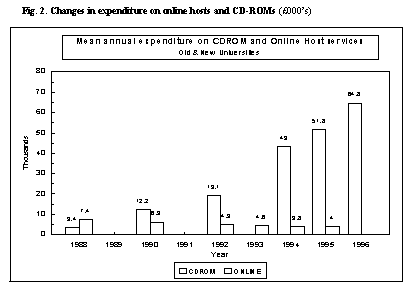
In the event, our measurement of commercial online service supply proved to be of diminishing relevance. Information services are traditionally regarded as a free public good in academia. Commercial hosts charged mainly on a "pay as you go" sessional basis, and at the outset most academic access was mediated by librarians. This method of payment created problems for library managers: (a) were such services to be regarded as value-added and therefore chargeable back to the user or his department and (b) how did libraries deal with the unpredictability of demand and concomitant cost? The availability of databases in the CD-ROM format significantly modified the nature of demand. Fig. 2 illustrates how academic expenditure shifted to the CD-ROM medium from the commercial online hosts. It also persuaded us to discontinue eventually the labour-intensive task of analysing online invoices: it was no longer cost effective to do so.
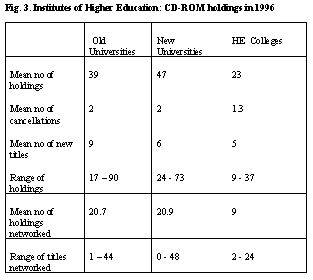
By 1989 we had begun to collect data on CD-ROM acquisitions, using the same representative panels, but asking the respondents to complete a questionnaire in an annual survey. Initially we collected only how much institutions were spending on the medium and which titles they were buying. As the take-up of CD-ROMs progressed, we also requested information on which titles were stored on hard disc, which were available through campus networks and the title cancellation rate. Increasingly libraries have CD-ROM holdings that are now financed externally from departmental funds (ie not acquired directly through general library funds), and we collect this information also. <> Fig 3 illustrates the number of current CD-ROM holdings in 1996 and the extent to which they are networked [4]
The annual questionnaire surveys present an opportunity to get more general indications from service librarians as to how the balance of different forms of media delivery is modifying in the light of technological change. Recent evidence suggests that there may be a move towards subscription to online services supplied through the World Wide Web, though it is too early to suggest a definite trend in this direction.
These developments produced a fundamental change in one aspect of our statistical activities. Each JISC acquisition was made through a single negotiation with the database owner and on the assumption that the information would be available to any bona fide member of the academic community. The licence fee paid reflected, to some extent, predicted levels of use. Individual universities (ie JANET sites) were required to pay a fixed annual subscription which was the same for each institution, regardless of the level of use. (1) The JISC policy was that access to the service would be "free to endusers at the point of use".
The effect of this strategy was that, provided that a university paid its annual subscription, any of its users (both staff and students) who had a terminal connected to the JANET network could have unlimited access to a particular database, free of any personal charge. (2) Relieved from the pay-as-you-use restriction, it was now possible to get a clearer indication of actual use. For commercial online services, and for subscriptions to agencies marketing CD-ROMS, our indicators were based solely on the revenues due to the supplier. This is arguably a somewhat imperfect measure of actual use (though it is, of course, of significance to library budget holders).
There are now three major datacentres (in Bath, Manchester and Edinburgh) providing access to databases that have been acquired through JISC negotiation. Each produces regular service statistics of use. The most significant measure is the number of connects made to the database service. (The amount of time spent connected to the service is also a useful indicator. We have shown that, in practice, there is a high correlation between the number of log-ins and the mean time spent during connection.). Also recorded are the number of connections made for each individual site: in this way the volume of use per university is measurable.
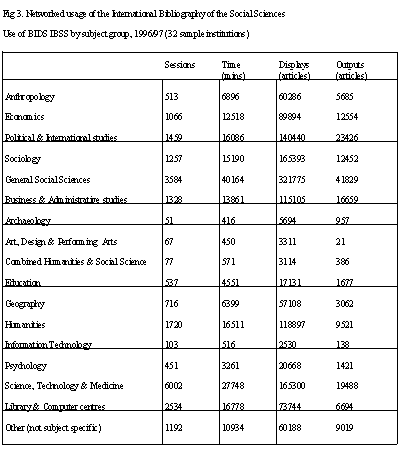
Each datacentre generates usage statistics of its services. For those of us who study the statistics of service growth, this is a considerable improvement both in accessibility and consistency of the data. Fig. 3 gives an example of statistics derived for networked usage of the International Bibliography of the Social Sciences (IBSS). In this table the usage attributed to various academic departments over two years is indicated in terms of the number of sessions conducted, the total elapsed time of the connections, the number of retrieved references displayed and the number of output articles selected.
Such data, centrally collected and readily retrievable in computer readable form, is a distinct improvement on our earlier methods of gathering commercial host statistics, which succeeded almost by stealth. Unfortunately, more detailed information on the nature of the users (whether they are students, researchers or teaching staff, and what are their stated subject interests) is no easier. To obtain such information, it is necessary to sample users by a questionnaire. Fortunately the nature of the centralised system allows us to sample in real time. This is further examined in the section called "identifying users"
In the United Kingdom, universities are evaluated approximately every five years in terms of their research outputs: the so-called "research assessment exercise" (RAE) (3). We correlated the extent of usage of the ISI database (ie number of sessions) of each university with the universities total RAE score. Fig. 4 indicates the high correlation obtained. [6]
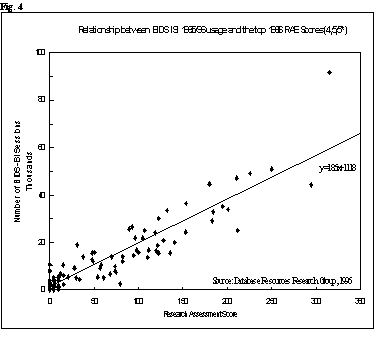
One of the significant points of this finding was that the uniform - and relatively high - annual subscription for this particular database was favouring research-oriented universities. Universities not in this group might tend to not renew their subscriptions when they considered their relatively low level of use.
Each userid has a three-letter code which indicates the site at which the user is registered. (For example, mine contains the letters "CIT", which indicates that I am a City University user.) Depending on the local site administrator, the remaining five digits of the code may contain additional personal information. In some cases, the code is used to indicate the department to which the user belongs (eg PHY for a physics department) and in rarer cases the status of the user is also identified (eg U for undergraduate, S for Staff). But there is no unified approach across the various sites.
Thus, it is easy to tabulate the level of usage at a site (and much more about the nature of the search conducted) but not the characteristics of the user. In early analyses we attempted to use what data was available from userids, by approaching each site administrator in turn and asking what (if any) was the local "translation" of the codes. This was a tedious process, also unsatisfactory in yielding only a sample (and not a particularly random sample) of user information. Moreover, useful data from a particular site rapidly became out of date, due to the inevitable turnover in the academic community. Nevertheless, we were obliged to use this approach in early analyses. This was how the figures were obtained in the examination of networked usage of the International Bibliography of the Social Sciences (IBSS): see Fig 3.
In a more recent survey we tried an alternative approach, which has proved to be much more effective. It was tested experimentally on the Bath University ISI service. We designed a short questionnaire requesting information from the user. This was loaded into the system software to appear on the terminal screen of a (random) sample of users as they logged in to the system. It was designed for the web version of the system, where the user is only required to "point and click" using a mouse. The design used radio buttons, check boxes and pull-down menus. This was to reduce size, control ways in which questions could be answered and generally to maintain clarity. Users were, of course, given the opportunity to say "no" to our questionnaire and depart immediately to their searching. Nevertheless 47% of the questionnaires were completed which is a fairly respectable return for a survey of this type.
We ran the questionnaire, without a break, for three weeks late last year (1997) and obtained a convincing "profile" of users consisting of data about their age and sex, status (eg undergraduate to professor) and area of subject specialisation. Additional data was gained on the location of the terminal they were using (eg in a library, computer centre, a private office or at home) and their frequency of use of the service. Nobody, of course, was asked to identify themselves by name.
Fig 5 is a small sample of the rich returns we were able to obtain through this technique. This particular example was concerned with the findings of the above "location of use" question. This indicated that very nearly half of the searchers were accessing the database from terminals other than those located in "public space" locations. In other words, nearly half of the users of this database were not going to the library or computer rooms as a place to access this type of information; the majority use equipment installed in private offices or laboratories. Not surprisingly, it is the undergraduate students who resort most to public access locations.

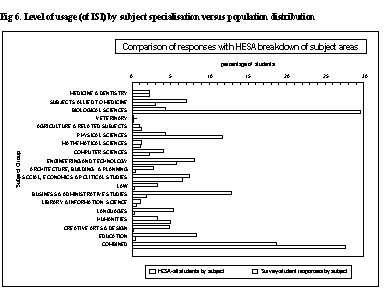
The ISI database, while covering a wide range of academic interests, is particularly strong in the scientific literature. The high level of use of both physical and biological sciences is consistent with this. In future research we hope to look at each database in turn and, depending on its subject scope, determine the extent to which the service is reaching its target population. In other words, we want to be able to estimate the degree of penetration of a particular service to different sectors of the academic community